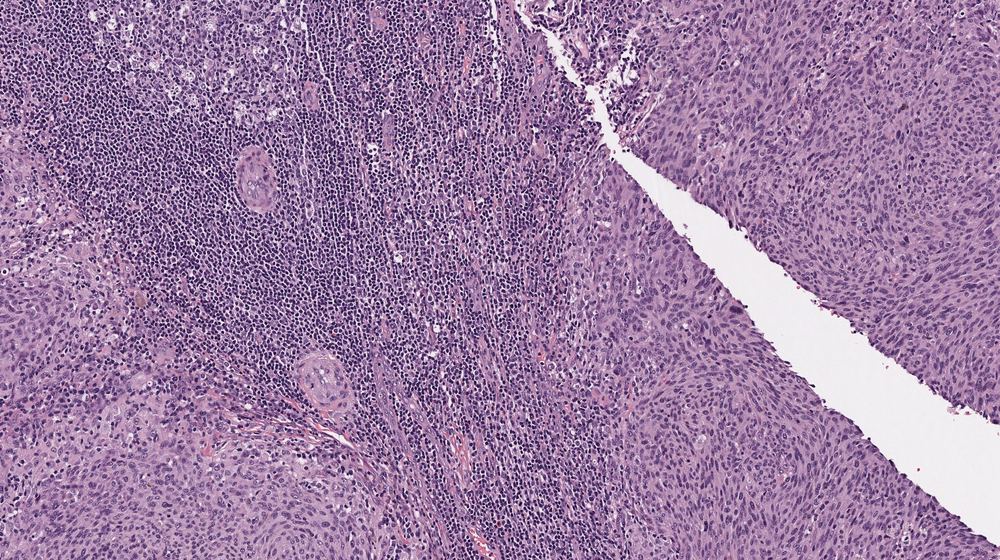
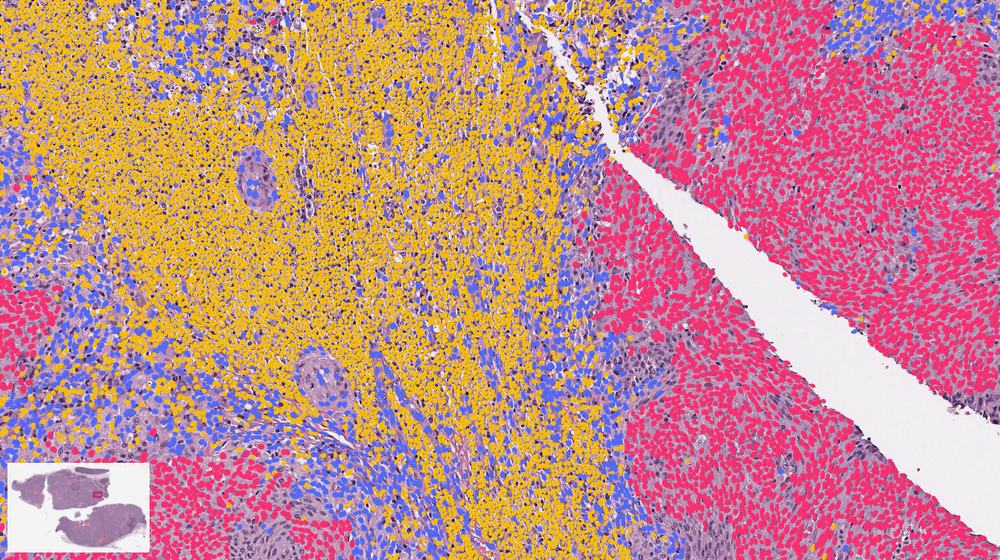
 What’s visible to the eyeWhat CHAI reads
- tumor cell
- immune cell
- stromal cell
The question every oncologist asks
Ask any cancer doctor what one of their hardest problems is, and you hear the same answer:
Which treatment will work for this patient?
There is almost never one treatment for everyone. There are several options, each with real side effects, and very little to tell a doctor which one this particular patient will respond to.
That question shows up on day one, right after the diagnosis, for the majority of cancer patients. It is the problem Valar Labs exists to solve.
What happens after “it might be cancer”
While the treatment can differ, nearly every cancer diagnosis starts the same way. A doctor removes a small piece of the tumor, called a biopsy. In the lab it is sliced thinner than paper, stained so the cells stand out, and placed on a glass slide. A pathologist, a doctor who specializes in reading tissue, examines it under a microscope and answers the first question: is this cancer, and what kind?
That glass slide has been the foundation of cancer medicine for a hundred years.1 For nearly every cancer, there is no definitive diagnosis without one.2
Then the hard part begins. A diagnosis is not one decision but a chain of them, made over months and years. The questions vary with the cancer and the patient, but they often look something like this:
- How aggressive is this cancer? Will it come back after surgery, or is the patient already cured?
- How much treatment? Surgery alone, or surgery plus chemotherapy or radiation, with their side effects?
- Which drug? Most cancers have several options, and they don’t work equally well for everyone.
- What next? How closely to watch, and what to do if it returns.
Two patients can have the same cancer, at the same stage, and very different futures.
One is cured by surgery; the other relapses within a year. The main tool doctors have for telling them apart is the stage, a rough measure of how big the tumor is and how far it has spread. It is a coarse label for a disease that is different in every patient. In colon cancer, for example, some patients at a lower stage do worse than patients at a higher one.3
So many patients get harsh treatment they didn’t need, and some don’t get the treatment they did need.
Same stage, different futures
Illustration · two hypothetical patients with stage II colon cancer
The revolution that left most patients behind
Twenty years ago, sequencing the human genome promised to fix this. Read the tumor’s DNA, find the mutation driving it, give the drug that targets it. If you had asked then whether genomics would personalize treatment for every cancer patient, the answer would have been of course.
It worked, for the patients who have one of those mutations. But they are a minority. Among people in the US with advanced cancer, an estimated one in seven were eligible for a genome-targeted drug in 2020, and about one in fourteen responded to one.5
Put another way, out of every fourteen patients with advanced cancer, about one has a tumor that shrinks on a drug matched to its DNA. What guides treatment for the other thirteen?
And most new cancer drugs are approved without a companion test that says who they will work for; even since 2011, only about four in ten have one.6 Molecular tests are also expensive and slow, and they consume the patient’s tissue sample.
There is a second, less obvious limitation. Increasingly, the way to discover what predicts a patient’s outcome is to let AI learn it from experience: many past patients, each with 1) their tumor data and 2) a record of what happened to them. That requires history, and molecular testing has little of it. Most patients treated in the past were never tested, so there is no large archive of results paired with outcomes for a model to learn from.
The lesson: precision oncology needs a new kind of data, one that tells doctors more about every patient’s tumor, not just the few with the right mutation.
The data has been hiding in plain sight
That data has been sitting on the glass slide all along.
Scanned, a single slide is a gigapixel image of hundreds of thousands of cells, and it is one of the richest data sources in medicine. Much of what is going on in the tumor is expressed in how it looks, including how the immune system is responding to it, how aggressive it is, even much of what its genes and RNA are doing.
Pathologists can tell a lot at a glance, but human eyes cannot count and classify every cell and tissue region on a slide, measure their shape, texture and distribution, or spatially map where immune cells sit relative to tumor cells.
For AI, it is close to an ideal problem:
- It exists for every patient. No new procedure, no extra tissue, no special equipment. We don’t want to build technology that only two or three hospitals in the world can use; the slide is the common denominator.
- It comes with history. Hospitals have archived slides for decades, alongside what happened to each patient afterward.
- The signal is spread across scale. It lives in the arrangement of hundreds of thousands of cells, which is exactly where a machine outperforms a human.
And the technology to read it has matured. The same computer vision that drives cars is now robust enough to apply to medicine.
Spilling the tea: what we have built at Valar Labs
CHAI (Computational Histology AI) is the vision foundation model we built to read the slide. Most approaches to this problem hand a neural network 1) images and 2) survival outcomes and ask it to learn the relationship between the two. That needs thousands of patients for every question, and it can’t tell you why it decided what it did.
We do it the other way around. We first teach the model tumor biology, and only then ask the clinical question.
So CHAI first learns to map the tissue, find and classify every cell, and compute thousands of measurements a pathologist would recognize, because they are the things pathologists already look for, just counted precisely and exhaustively. Many of them are direct traces of the hallmarks of cancer, the handful of traits every tumor acquires to grow and spread, such as evading the immune system and invading nearby tissue.7
How are the immune cells distributed alongside the tumor? How irregular are the nuclei? How are the glands structured? It turns the biology on the slide into math.
Then a small, simple formula combines a carefully curated selection of those measurements to answer one clinical question, and because each measurement is something a person can check, every answer comes with a reason. That matters, because every result we report can change a treatment decision.
It also means the model can point us to new biology. A black-box model can say a patient is high risk, but not why. When one of CHAI’s measurements, say how far immune cells reach into the tumor, turns out to predict who relapses, we know which property of the tumor matters, and that is a question biologists can go and test.
What CHAI sees on one slide
Real TCGA slides · the same model on every cancer · drawn from its actual output
Here is the part that matters for how fast we can move. The expensive half of the system, learning the biology, is the same for every cancer. We trained it once, across many cancer types, and we keep improving it. Adding a new cancer, or a new question, does not mean building a new network. It means choosing which of the measurements we already make matter for that question, and how much, and that takes far fewer patients. Every time the shared half gets better, every cancer readout gets better at once.
If the model learns to distinguish an immune cell from a tumor cell more accurately, for example, every measurement that depends on that distinction improves across bladder, prostate and every other cancer, without collecting a new set of patients for each. (Part 3 explores this in more detail.)
Why “superintelligence”
The term “superintelligence” is now used so widely that it risks losing its meaning. We use it deliberately, and in its strict sense: performance that exceeds what the best human experts can achieve.
Across the full range of human reasoning, that remains speculative. However, within a well-defined domain, it is already achievable. No person can count every cell on a slide, classify each one, and map where it sits relative to the tumor; there are hundreds of thousands of them. CHAI can.
This does not replace the pathologist or the oncologist. It gives them information beyond the limits of human perception, so that their decisions are better informed. Two properties make this possible:
- It sees everything on every slide. Every cell, in every patient, measured the same way every time.
- What it learns in one cancer, it brings to all of them. A specialist in bladder cancer doesn’t get better at breast cancer. CHAI does.
Put those together and every decision in the chain above becomes the same kind of problem, a new question asked of one shared understanding of the tumor. That is our north star:
To inform every clinical decision in cancer, for every patient, from data that already exists.
The payoff is bigger than it sounds. A new cancer drug costs from under one billion to nearly three billion dollars to develop,8 and many are approved for adding a few months over the current standard of care.9 Getting each patient onto the right treatment we already have can do more than that, today. It also cuts costs, because the most expensive care is a course of treatment that was never going to work, or a cancer that got worse when it could have been caught.
This is already happening in patient care. Bladder cancer was first: our test is used in clinics today, and in a study of how doctors used it, it changed the treatment plan in two out of three cases.10 Prostate and pancreatic cancers followed on the same foundation. In trials, the same approach has picked out which patients benefit from more intensive chemotherapy, and which are better off without it.
A preview of Part 2: tackling twenty cancers at once
If the biology CHAI learned is truly general, a readout built on it should work in any solid tumor, including ones we never set out to study. So we tested it on twenty cancer types at once, using The Cancer Genome Atlas, a public collection of tumor slides from thousands of patients with years of follow-up.
The rules were strict. The models that read the slide were not retrained for any of the twenty cancers. For each cancer, we fit a small readout on 30% of the patients, locked it, and then tested it once on the other 70%, patients it had never seen. The question was the same everywhere: after treatment, whose cancer will progress? We compared the patients it flagged as high risk with everyone else, after accounting for age, sex and stage, the things a doctor already knows.
Each bar below shows how many times as fast the flagged patients’ cancer progressed.
Preview · twenty cancers, one model
The Cancer Genome Atlas · 20 cancer types in 9 organ groups · patients the model never saw
0cancer types
A risk flag matters because of what it can change. It can help a doctor decide who may need more, such as closer follow-up, additional treatment after surgery, or switching sooner to a different therapy, and who may safely be spared treatment that would bring side effects without benefit.
Part 2 presents this study in full, including how each cancer did, what the readouts look at, and what “patients the model never saw” does and doesn’t mean. Part 3 is why we don’t train one giant black-box network, and how that lets us learn from small data.
References
- Titford M. The long history of hematoxylin. Biotech Histochem 2005;80(2):73–78.
- Fischer AH, Jacobson KA, Rose J, Zeller R. Hematoxylin and eosin staining of tissue and cell sections. CSH Protoc 2008; doi:10.1101/pdb.prot4986. National Cancer Institute, “How Cancer Is Diagnosed”.
- Chu QD, et al. BMC Cancer 2016;16:460 (stage IIIA vs IIB/C colon cancer survival).
- Galon J, et al. Type, density, and location of immune cells within human colorectal tumors predict clinical outcome. Science 2006;313(5795):1960–1964. Pagès F, et al. International validation of the consensus Immunoscore for the classification of colon cancer. Lancet 2018;391(10135):2128–2139.
- Haslam A, Kim MS, Prasad V. Ann Oncol 2021;32(7):926–932 (estimates for US patients with advanced cancer, 2020: 13.6% eligible, 7.0% respond, using the response rate on each drug’s FDA label).
- Jørgensen JT. Front Oncol 2025;15:1635491 (companion diagnostics for oncology drugs, 1998–2024).
- Hanahan D. Hallmarks of cancer: new dimensions. Cancer Discov 2022;12(1):31–46. Hanahan D, Weinberg RA. Cell 2011;144(5):646–674.
- Wouters OJ, McKee M, Luyten J. JAMA 2020;323(9):844–853. Prasad V, Mailankody S. JAMA Intern Med 2017;177(11):1569–1575.
- Ladanie A, et al. JAMA Netw Open 2020;3(11):e2024406 (median survival gain 2.4 months, FDA approvals 2000–2016).
- Packiam V, …, Smith A. Cancers 2026;18:249 (decision impact in NMIBC).
Cite this post
Valar Labs. "Towards a cancer superintelligence." Valar Labs Blog, October 2026. https://valarlabs.com/blog/towards-a-cancer-superintelligence
This is how we’re changing cancer care today.
CHAI is not only a research result. The same foundation reads the slides behind the tests physicians order from us now, for real treatment decisions.